
The report wizard builds grid and pivot reports step by step: choose the entity the report reads, join the related entities it needs, pick fields and arrange them as columns, add grouping, summaries, buckets and filters, then name and save it. The result opens immediately in the viewer and behaves like any other report — shareable, cloneable, subscribable. Document reports start in the same wizard (titled Document Report Data) and continue into the report designer.
Prerequisites
- The Reports page of an app you can open; the New actions sit in its page header.
- A clear idea of the primary entity — every row of a report starts as a row of one entity, with related data joined onto it.
- For a pivot report, know what you want on rows, on columns and aggregated in the cells before you start; it makes the layout step quick.
The step rail
A grid report walks nine steps: Data Source, Relationships, Fields, Columns, Display Grouping, Display Summary, Bucketing, Filters, Details. A pivot report replaces Columns, Display Grouping and Display Summary with one Pivot Layout step and skips Bucketing. A document report skips Bucketing. Next stays disabled until the current step has what it needs; Reports in the header leaves the wizard without saving.
Procedure
Step 1 — Start a new report
Open Reports and choose New for a grid report or New Pivot Report for a pivot. The wizard opens as New Report (or New Pivot Report) on the Data Source step.
Step 2 — Choose the data source
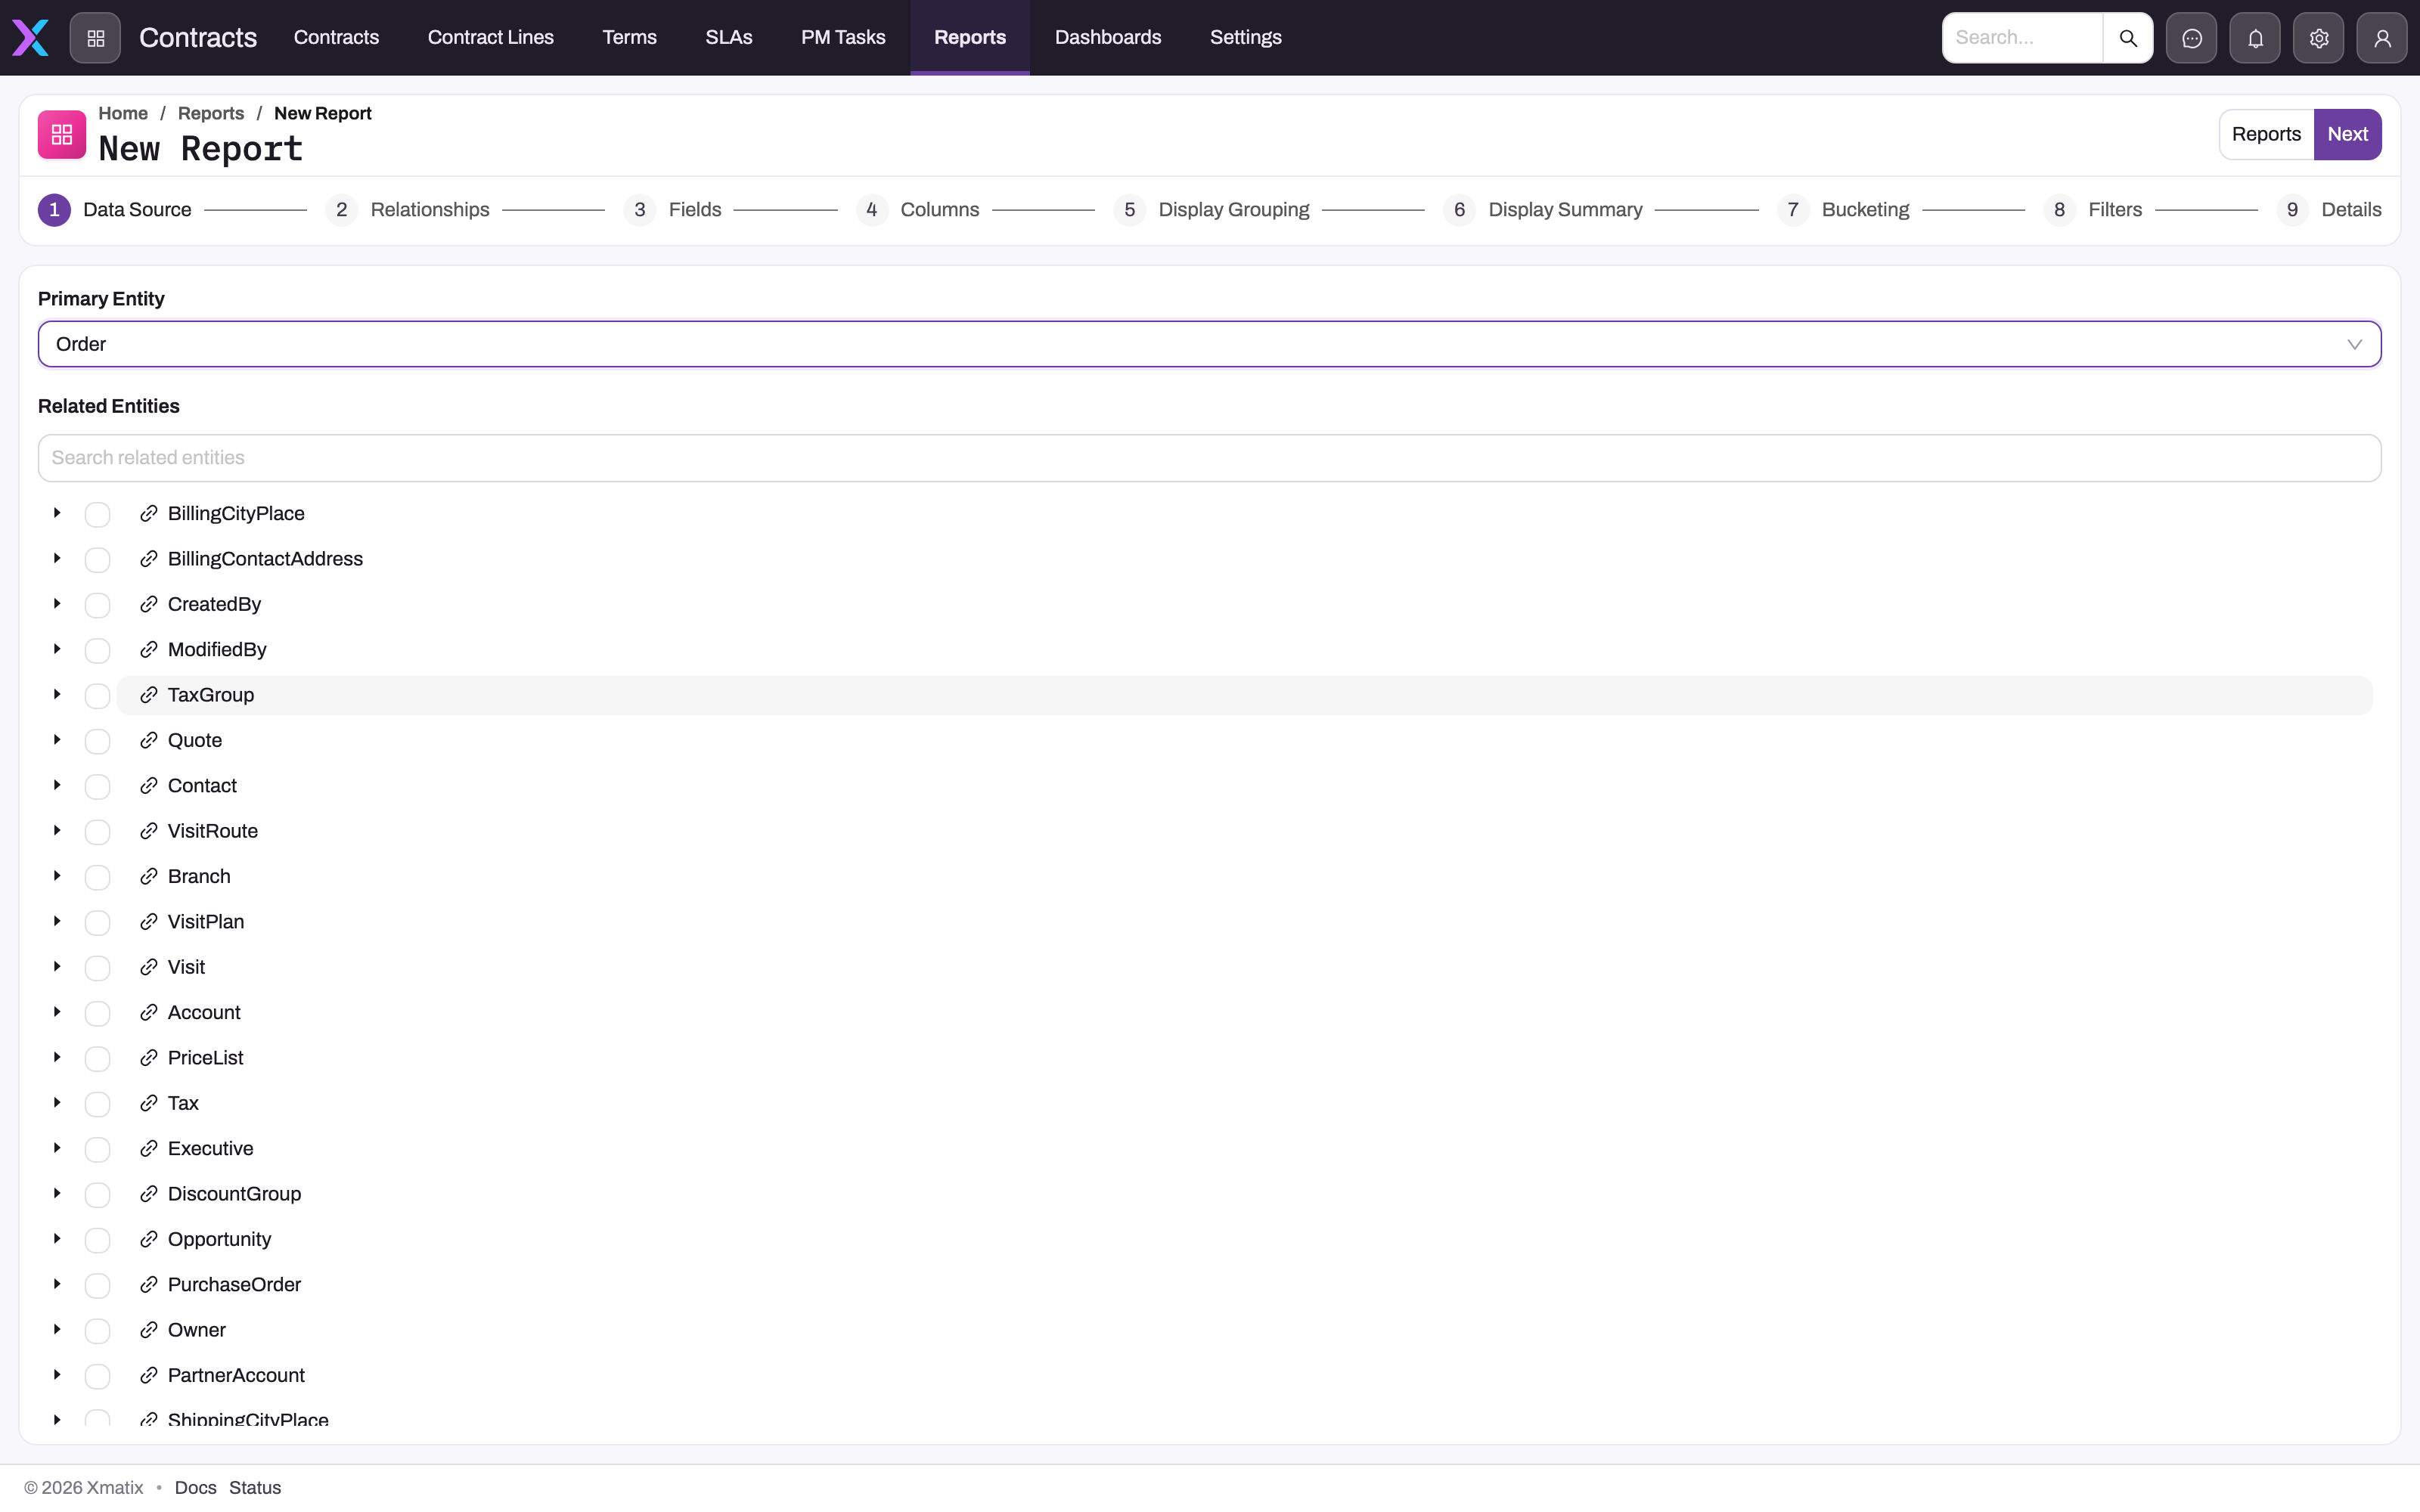
Pick the Primary Entity — orders, invoices, visits, any entity in your data model including custom ones. This decides what one row of the report is: a report on orders produces one row per order, before any grouping. Once it is chosen, Related Entities lists the entity's lookups (link icon) and child collections (branch icon); tick the ones whose fields you need, and expand one to walk further along the relation. Search related entities narrows a long list.
- 1
The step rail shows the grid-report sequence; a pivot report replaces Columns, Display Grouping and Display Summary with one Pivot Layout step, a document report drops Bucketing. Next stays disabled until the step is complete.
- 2
Primary Entity decides what one row of the report is — here one row per order, before any grouping.
- 3
Related Entities lists the primary entity's lookups (link icon) and child collections (branch icon); tick one to join its fields and expand it to walk further.
- 4
Next opens Relationships, where each ticked relation gets its record-matching rule; Reports leaves the wizard without saving.
- 5
Search related entities narrows a long relation list — the Order entity alone has more relations than fit on screen.
Step 3 — Set the relationships
Each ticked relation gets a Record matching rule: Keep all base records (a left join — rows without a match keep their place with blank related fields) or Only matched records (an inner join — rows without a match are dropped). Additional match rules let you add field-to-field conditions on top of the relation's own key. Reach for Only matched records deliberately: it is the most common reason a finished report has fewer rows than expected.
Step 4 — Choose fields
Select the fields to include from the primary entity and everything you joined. Fields are listed per entity with their captions; a lookup field brings its display name along, so a report on orders can show the account's name rather than its identifier.
Step 5 — Arrange the columns
The Columns step turns selected fields into the grid: set each column's caption, Width (px) and default sort (ascending or descending), drag to reorder, and group related columns under a band — a header row that spans several columns, given its own band label. You can also add a calculated column: an expression over the other columns. The expression is validated as you type against the columns actually present in the report, and an invalid one is refused with the position of the problem, so fix it in place before continuing.
Step 6 — Group and summarize
Display Grouping nominates columns to group rows by — by customer, by status, by a date at Year, Quarter, Month, Day or Day of Week granularity. Display Summary adds the arithmetic: Sum, Average, Count, Min or Max per column, shown per group and for the report total, with optional custom labels and a choice of where group summaries appear (in the group row, in a group footer, or both). A report with grouping and summaries reads as answers rather than raw rows.
Step 7 — Add buckets (grid reports)
Bucketing splits a measure across generated columns so a flat query becomes a comparison you can scan. Each bucket definition has a Label, an Active switch, a Bucket type — Numeric ranges you define (half-open: from ≤ value < to), Picklist values (one column per value) or Date (calendar periods, or a comparative period such as this month against last) — the field to Bucket on, an Aggregate (type and field) and an optional Caption prefix; values outside your ranges land in an Overflow column labelled Other unless you rename it. The wizard warns when a filter already restricts the field you are bucketing on.
Step 8 — Filter
Add the report's built-in conditions — the ones that define what the report means, such as Status = Open or a date window. Mark a condition as Promoted to expose it in the viewer as a filter bar, so readers can change the period or branch without opening the filter builder. Viewers can always add their own filters on top; theirs narrow the result without changing yours.
Step 9 — Name it and save
The Details step takes the Name (a unique internal name such as MonthlyRevenueReport), the Label readers see, a Description and the Folder — pick an existing folder or type a new one, as Persona/Sub-folder or a plain name (see Reports for how folders are read). For a grid report, Grid Layout offers Use centered content width for narrow reports. Visibility is not set here: the step reminds you that reports are created as private and shared afterwards. Save, and the report opens in its viewer with live data.
Step 10 — Share it
A new report is visible only to you. When it is ready for others, open its row's Edit action in the library and set Visibility to All users or Selected users with roles, profiles and teams — see Sharing & access for the mechanics and the pitfalls.
Expected result: the saved report opens with live rows, its totals and filters answer the intended question, and only the selected audience can discover and run it.
Pivot reports
Choosing New Pivot Report swaps the column steps for Pivot Layout: drag the selected fields into the row, column and data areas and choose each data field's aggregation. Adding or removing fields in the Fields step is reflected in the layout immediately without losing the placements you already made. The saved report opens in the pivot viewer as a matrix and exports to Excel and PDF.
Common problems
- Fewer rows than expected. Almost always a relation set to Only matched records dropping rows that have no match, or a built-in filter tighter than intended. Switch the rule to Keep all base records, or loosen the filter, and compare the Total Records count.
- A calculated column will not save. The expression validator rejected it and reports the offending position. Check field names against the columns you actually selected — an expression can only reference columns present in the report.
- The report runs but colleagues cannot find it. It is still private. Nothing is wrong with the report — share it (Sharing & access).
- Next is disabled. The current step is missing something required — most often a primary entity on Data Source or a label on Details.
Common questions
Can I change a report after saving it?
Yes — Edit in the report viewer's actions menu, or Design on the library row, reopens the wizard pre-filled with the current definition, and saving applies the changes in place. Sharing and subscriptions survive the edit; anyone who runs the report next sees the new definition. Note that Save in the viewer toolbar also writes column and filter changes into the shared definition — see Reports.
When should I pick a pivot report over a grid?
Pick a pivot when the question is inherently two-dimensional — sales by product by month, counts by status by team — and you want the second dimension spread across columns with aggregated cells. Pick a grid when you need to see and work with the individual rows: sorting, scanning, exporting a list. A grid with bucketing covers the middle ground, generating comparison columns while keeping the row-level view.
Is the data a snapshot from when I built the report?
No. A report stores only its definition; the query runs afresh every time anyone opens it, so the result always reflects the data at that moment. If you need a fixed point-in-time copy, export the result from the viewer, or set up a subscription — each delivery is generated at send time.